
It's 7 AM on a Saturday. Mummy is at the vegetable market. She picks up tomatoes, weighs them, asks the price, and puts them back. ₹120/kg today. "Pichle hafte ₹60 tha," she mutters. She moves to onions. ₹50/kg. Not terrible, but not great. Potatoes — ₹35/kg. "Yeh toh theek hai."
This ritual — picking up, checking price, calculating, sometimes reluctantly buying, sometimes putting back — happens in every Indian household, every week. It's our most visceral, tangible experience of inflation. Not charts and graphs and CPI numbers, but ₹120 tomatoes when you expected ₹60.
But have you ever wondered WHY food prices change so much? Why can tomatoes cost ₹20/kg one month and ₹200/kg two months later? Why does dal stay expensive for years at a stretch? Why do onions make finance ministers cry (sometimes literally)?
I'll try to break down every major factor behind food inflation in India — or at least the ones I think matter most. Some of it's probably common knowledge, but some of it surprised me when I dug into it. Once you understand the system, you'll never look at the sabzi mandi the same way again. Maybe you'll even feel a little less angry at the vendor.
Chapter 1: The Monsoon Factor — India's Single Biggest Price Determinant
Let's start with the most important variable: rain. India's agriculture is still overwhelmingly rain-dependent. Despite decades of irrigation expansion, about 52% of India's net sown area remains rain-fed (unirrigated). This means more than half our food production depends on the monsoon showing up on time and in the right quantity.
Here's how the monsoon-price connection works:
- Normal monsoon (within 10% of Long Period Average): Good harvests, ample supply, prices stay stable or drop. Example: 2016, 2019, 2024 — food inflation averaged 3-4%
- Deficit monsoon (below 90% of LPA): Reduced crop yields, supply shortages, prices spike. Example: 2009, 2014, 2023 — food inflation hit 8-12%
- Excess monsoon (above 110% of LPA): Flooding damages standing crops, especially pulses and vegetables. Paradoxically, too MUCH rain also causes price spikes. Example: August 2024 floods destroyed tomato crops in Karnataka, prices tripled
- Uneven distribution: Even when total rainfall is "normal," if it falls heavily in some regions and not others, localized shortages create price spikes in those areas
A farmer in Maharashtra once explained it to me beautifully: "Bhagwan deta hai toh sab sasta. Nahi deta toh sab mehnga." God gives (rain), everything is cheap. God doesn't, everything is expensive. In one sentence, he captured the entire monetary policy challenge of the world's most populous country.
I'd been reading RBI reports and academic papers for weeks, trying to understand food inflation dynamics. His seven-word Hindi phrase probably explained what those 50-page documents couldn't. Sometimes the clearest economic insights come from people living closest to the source—or at least, that's what I think.
Chapter 2: The Supply Chain — Where Your ₹100 Actually Goes
When you buy vegetables for ₹100 at the market, how much does the farmer get? In India, the answer is depressingly little. Let me trace the supply chain for a common vegetable — say, tomatoes:
| Stage | Price Per Kg | % of Final Price |
|---|---|---|
| 1. Farmer's gate price | ₹15-20 | 15-20% |
| 2. Village trader/commission agent | ₹25-30 | Adds 5-10% |
| 3. Transport to mandi (truck/tempo) | ₹35-40 | Adds 10% |
| 4. APMC mandi commission | ₹42-48 | Adds 7-8% |
| 5. Wholesale trader | ₹55-65 | Adds 15-17% |
| 6. Transport to retail market | ₹70-75 | Adds 10% |
| 7. Retail vendor markup + wastage | ₹90-100 | Adds 20-25% |
The farmer gets ₹15-20, maybe less. You pay ₹90-100. The supply chain absorbs roughly 75-80% of the final price. And this is for a SHORT supply chain (farm to local market). For pulses, which travel from Madhya Pradesh to Kerala, or rice from Punjab to Tamil Nadu, the chain is longer and the margins are probably even thicker.
Here's what really stings: when tomato prices crash to ₹5/kg at the farm gate (oversupply, maybe), you're still paying ₹35-40/kg in the market. The supply chain doesn't proportionally reduce its cut. Farmers lose money selling at ₹5, but you don't see savings because middlemen maintain their absolute margins. It's a broken mechanism that hurts both ends of the chain. Honestly, I'm not sure anyone has figured out how to fix this without completely restructuring the entire agricultural supply chain.
Here's the critical insight: most food inflation isn't about production cost at the farm. It's about transportation, commission, wastage, and retail markup costs going up. When diesel rises by ₹10/litre, every vegetable in India automatically becomes ₹5-10 more expensive because trucks carry all of them.
Chapter 3: Why Different Foods Inflate Differently
Not all foods inflate equally. Understanding why helps you make smarter grocery decisions:
Vegetables (High Volatility: ±50% in months)
Vegetables are perishable — they can't be stored for more than 5-10 days. This means supply must match demand in real-time. Any disruption (rain, heat wave, transport strike) immediately shows up as a price spike. Tomatoes, onions, and potatoes (called TOP in government circles) are the most politically sensitive because they're consumed daily by every household.
Price volatility is wild. In 2023, tomatoes went from ₹40/kg in May to ₹250/kg in July to ₹30/kg in October. That's roughly a 525% swing in 5 months. I don't think any other asset class in India — not gold, not stocks, not real estate — comes close to this kind of volatility. It's probably the single most unpredictable item in your kitchen budget.
Pulses (Medium-High: 10-40% annual swings)
India imports 15-20% of its pulses. This means global prices affect your dal. When Canada (our largest pulse exporter) had a drought in 2021, toor dal prices in Indian markets jumped 30%. You're eating Canadian lentils without knowing it, and paying Canadian drought premiums.
Edible Oils (Moderate: tied to global markets)
India imports 55-60% of its edible oil. Palm oil from Indonesia/Malaysia, sunflower oil from Ukraine/Russia, soybean oil from Argentina. When the Russia-Ukraine conflict started in 2022, sunflower oil prices in India doubled overnight. Your poori became more expensive because of a war 5,000 km away.
Cereals — Rice & Wheat (Low-Moderate: 5-15% annual)
Government-controlled through MSP (Minimum Support Price), PDS distribution, and buffer stocks maintained by FCI (Food Corporation of India). This is why rice and wheat prices are relatively stable — the government literally buys and stores millions of tonnes to prevent spikes. The cost of this stability? The FCI's annual food subsidy bill: ₹2 lakh crore+.
Milk (Moderate: 8-12% annual, but relentless)
Milk is a fascinating case. It rarely spikes dramatically, but it increases steadily year after year, faster than general inflation. In 2005, Amul Taaza (500ml) cost ₹12. In 2026, it costs ₹32-34. That's 177% increase — well above CPI inflation of ~140%. Milk inflation is driven by feed costs, logistics, and the fact that demand grows faster than supply (India's dairy consumption increases 4-5% annually).
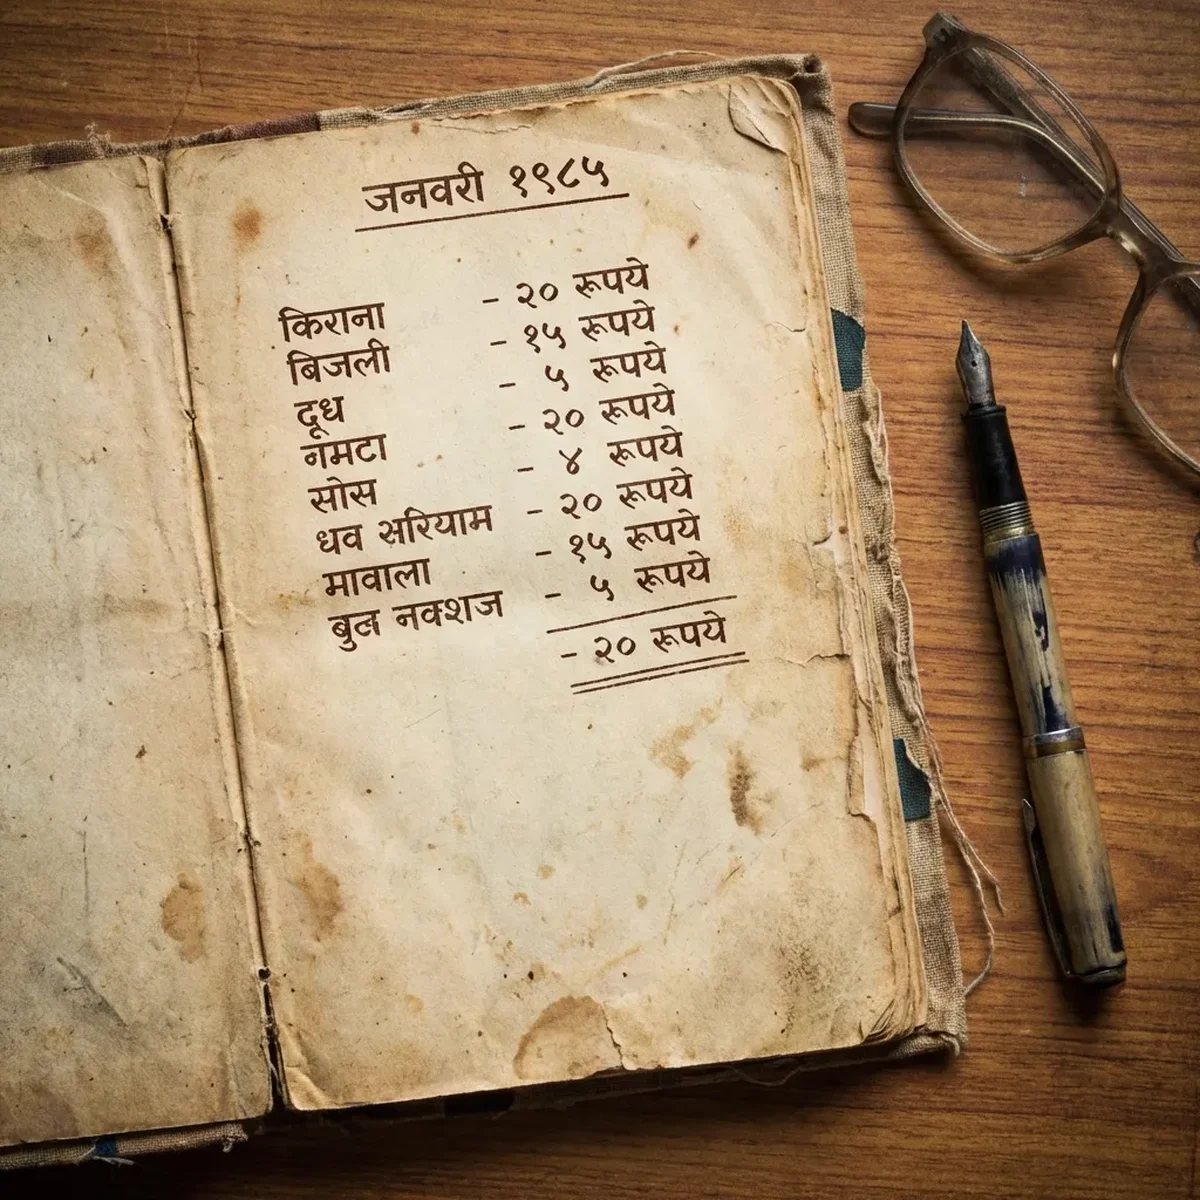
Tracking grocery expenses — a habit that reveals inflation more honestly than any official index
Chapter 4: Global Factors You Can't Control
India's food prices are no longer determined solely within India. We're deeply integrated into global food markets. Here are the external factors:
Crude Oil Prices
Oil affects food in three ways: diesel for transport, energy for cold storage, and fertilizer production (which is petrochemical-based). When crude oil went from $40/barrel in 2020 to $120/barrel in 2022, fertilizer costs doubled, transport costs jumped 40%, and food inflation hit 7.8%.
Global Supply Disruptions
COVID taught us this lesson brutally. In 2020-21, lockdowns disrupted harvesting (migrant workers couldn't travel), transport (interstate restrictions), and distribution (mandis were closed). Food prices spiked 10%+ even as the overall economy was contracting. Inflation during a recession — the worst of both worlds.
Currency Depreciation
The rupee has depreciated from ₹45/USD in 2010 to about ₹86/USD in 2026. This makes ALL imports more expensive. Since India imports 55% of its edible oil, 15% of pulses, and essentially all its palm oil, a weaker rupee directly translates to higher grocery bills.
India imports → Edible oils (55-60%), Pulses (15-20%), Fertilizers (30-40%)
These imports are priced in USD → Rupee depreciates → Import bill rises → Costs passed to consumers
A 10% rupee depreciation adds approximately 2-3% to food inflation.
Chapter 5: The Government's Toolkit (And Why It Often Fails)
The government has several tools to fight food inflation. Here's an honest assessment of each:
1. MSP (Minimum Support Price)
How it works: Government announces a minimum price for 23 crops and buys unlimited quantities at that price from farmers.
Does it control inflation? Partially. MSP creates a price floor (farmers won't sell below it), which prevents deflation but can also keep prices artificially high. When MSP increases by 7% (as it did for wheat in 2024), retail prices usually follow.
2. Buffer Stock Operations
How it works: FCI maintains huge reserves of wheat and rice. When market prices spike, government releases stock to increase supply and bring prices down.
Does it work? For wheat and rice — yes, reasonably well. India's buffer stocks are typically 2-3x the required minimum. For pulses, vegetables, and edible oils — not really. The government doesn't maintain perishable buffers effectively.
3. Export/Import Controls
How it works: When domestic prices spike, government bans exports (to keep supply in India) or reduces import duties (to make foreign supply cheaper).
Does it work? Short-term yes. In 2023, onion export ban brought prices down 30% in 6 weeks. But it destroys farmer trust and India's reputation as a reliable exporter. And it's a band-aid — the structural issues remain.
4. PDS (Public Distribution System)
How it works: 81.35 crore Indians receive subsidized food through ration shops — rice at ₹3/kg, wheat at ₹2/kg under NFSA (National Food Security Act).
Does it control inflation? It insulates the poorest 60% from market price spikes. A family getting 5kg rice at ₹3/kg doesn't care if market rice is ₹50/kg. But it doesn't reduce market prices — it just shields beneficiaries from them.
Chapter 6: The Thali Index — Tracking Real Food Inflation
CRISIL publishes a "Thali Index" that shows the cost of a standard vegetarian and non-vegetarian thali across Indian cities. Here's the data for a veg thali:
| Year | Veg Thali Cost (North India) | Veg Thali Cost (South India) | YoY Change |
|---|---|---|---|
| 2015 | ₹25-28 | ₹22-25 | — |
| 2017 | ₹28-32 | ₹25-28 | +10% |
| 2019 | ₹30-35 | ₹28-32 | +8% |
| 2021 | ₹35-40 | ₹32-37 | +14% |
| 2023 | ₹40-48 | ₹38-44 | +15% |
| 2026 | ₹48-58 | ₹45-52 | +12% |
A veg thali that cost ₹25 in 2015 now costs ₹48-58, maybe more in metros. That's roughly a 100-130% increase in 11 years, or about 7-8% annually. CPI general inflation over the same period averaged 5.2%. Food seems like it's inflating roughly 50% faster than the overall economy.
And the thali doesn't even include snacks, fruits, beverages, or eating out. If you factor in the rising cost of chai (₹6 in 2015, ₹15 in 2026), samosa (₹8 to ₹20), and standard restaurant meals, the true "food experience" inflation is probably even higher—not sure anyone tracks this accurately, but from what I've seen in my own spending, it's definitely steeper than official numbers suggest.
My neighborhood Udupi restaurant charged ₹45 for a masala dosa in 2016. Today? ₹85. That's roughly an 89% increase in 10 years. They haven't changed the recipe or portion size, from what I can tell. But rent went up, cook salaries probably doubled, LPG got pricier, and sambar ingredients inflated. Every input cost rise flows straight to your plate.
Chapter 7: Smart Strategies to Fight Food Inflation at Home
Strategy 1: Seasonal Buying
Tomatoes in winter (October-January) cost 30-50% less than in monsoon or summer. Mangoes are cheapest in June. Oranges in December. Buying seasonal produce saves money because you're buying when supply is highest. Mummy has known this intuitively — now you know the economics behind it.
I tested this last year. Bought 2kg tomatoes in December for ₹50 (₹25/kg), made tomato puree, froze it in ice cube trays. Used those cubes all through April-May when fresh tomatoes hit ₹180/kg. Saved roughly ₹300 over two months, maybe more. Small amount, but multiply that across vegetables, fruits, and a year — it probably adds up to ₹5,000-8,000 in saved grocery money, possibly higher if you're disciplined about it.
Strategy 2: Buy Local and Whole
A whole chicken costs ₹180-220/kg. Boneless chicken breast costs ₹350-400/kg. You're paying a 70% premium for convenience (cutting and cleaning). Similarly, whole spices stored at home retain freshness for 12+ months. Pre-ground spice packets lose flavour in 3 months and cost 2-3x more per gram. Processing always costs money.
Strategy 3: Monthly Staples, Weekly Perishables
Buy atta, rice, dal, oil, sugar in monthly bulk — prices fluctuate less monthly and you often get 10% bulk discounts. Buy vegetables and fruits weekly or even bi-weekly — only what you'll consume. Food waste is India's most expensive inflation — we throw away 7% of our food due to spoilage at the household level.
Strategy 4: Track Government Schemes
If your family is eligible, ensure you have active ration cards (Jan Dhan-linked ration cards provide NFSA benefits). Use ONDC (Open Network for Digital Commerce) for direct farmer-to-consumer purchases. Services like Kisan Mandis and e-NAM connect buyers directly to farmers, eliminating 2-3 middlemen and saving 20-30%.
Strategy 5: The Substitution Approach
When toor dal is ₹180/kg, switch to masoor dal at ₹100/kg. When tomatoes spike, use tamarind paste (₹60 for 200g, lasts weeks). When chicken is expensive, eggs provide the same protein at 1/3rd the cost. Nutritional flexibility is your best hedge against food inflation — it removes the supplier's pricing power over you.
Pulling It All Together: Understanding Changes How You React
The next time tomatoes hit ₹200/kg, you'll know it's probably because of unseasonal rain damaging crops 3-4 weeks ago, combined with diesel price increases affecting transport, and perhaps a speculative hoarding cycle by mandi traders anticipating further shortages.
This knowledge doesn't make tomatoes cheaper. But it does two important things: it removes the emotional panic ("Everything is so expensive!") and replaces it with rational analysis ("This is a temporary supply disruption, prices will normalize in 4-6 weeks"). And it helps you make better decisions — buy alternatives, buy in bulk when cheap, or simply wait.
Food inflation in India will always be volatile because of our monsoon dependence, our massive population, and our complex supply chains. But understanding the mechanics gives you agency. You can't control the monsoon, but you can control your thali.
Use our Inflation Calculator to see how food prices have changed over any time period. And read our Father's Grocery Bill story for a personal perspective on food inflation.